
01
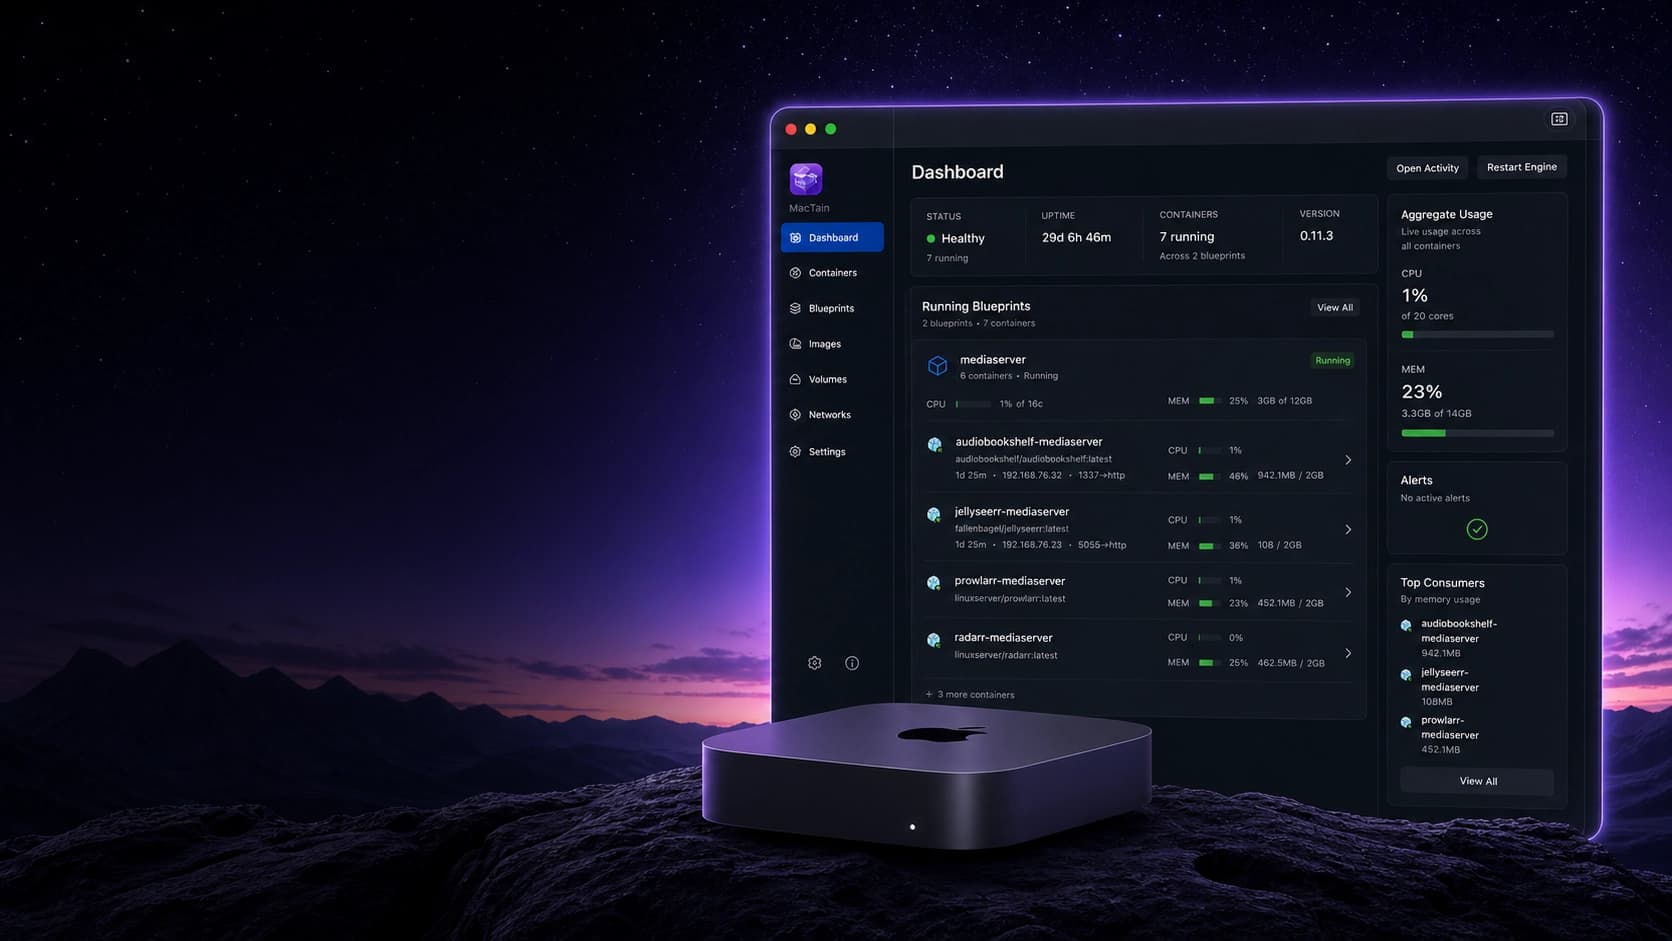
See every workload at a glance
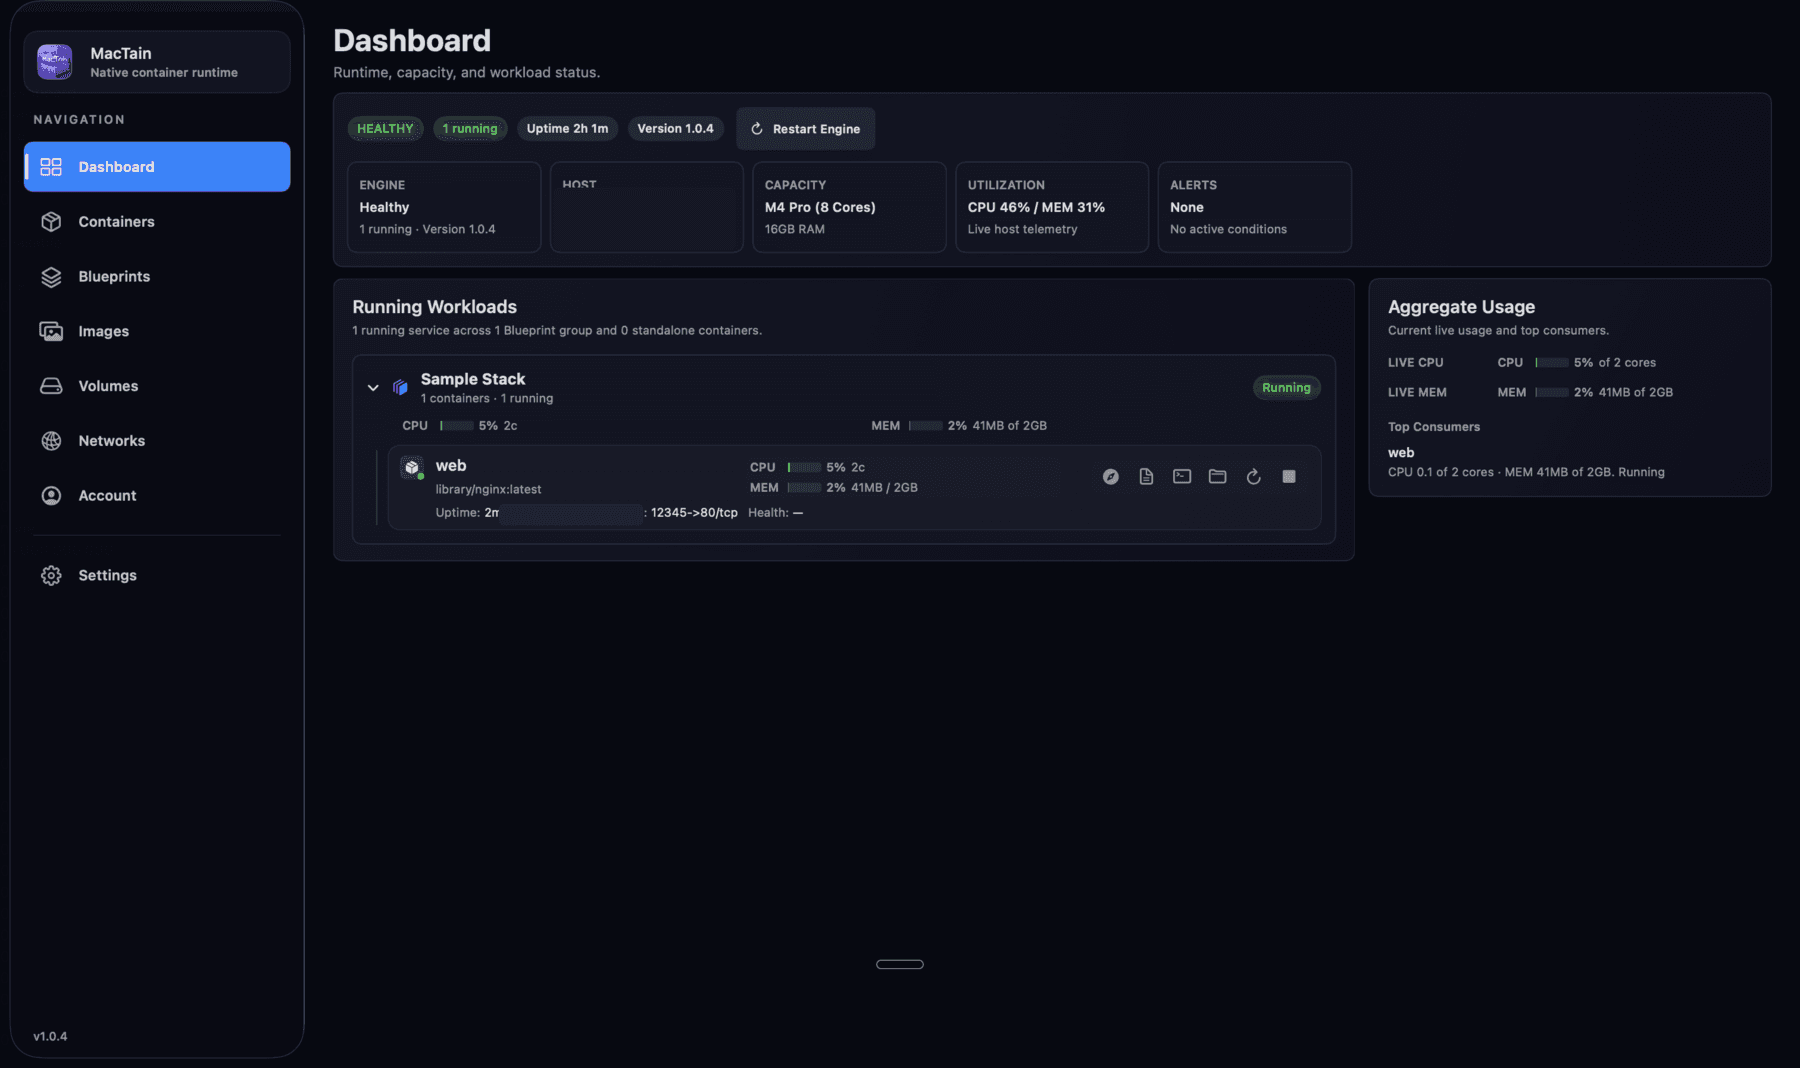
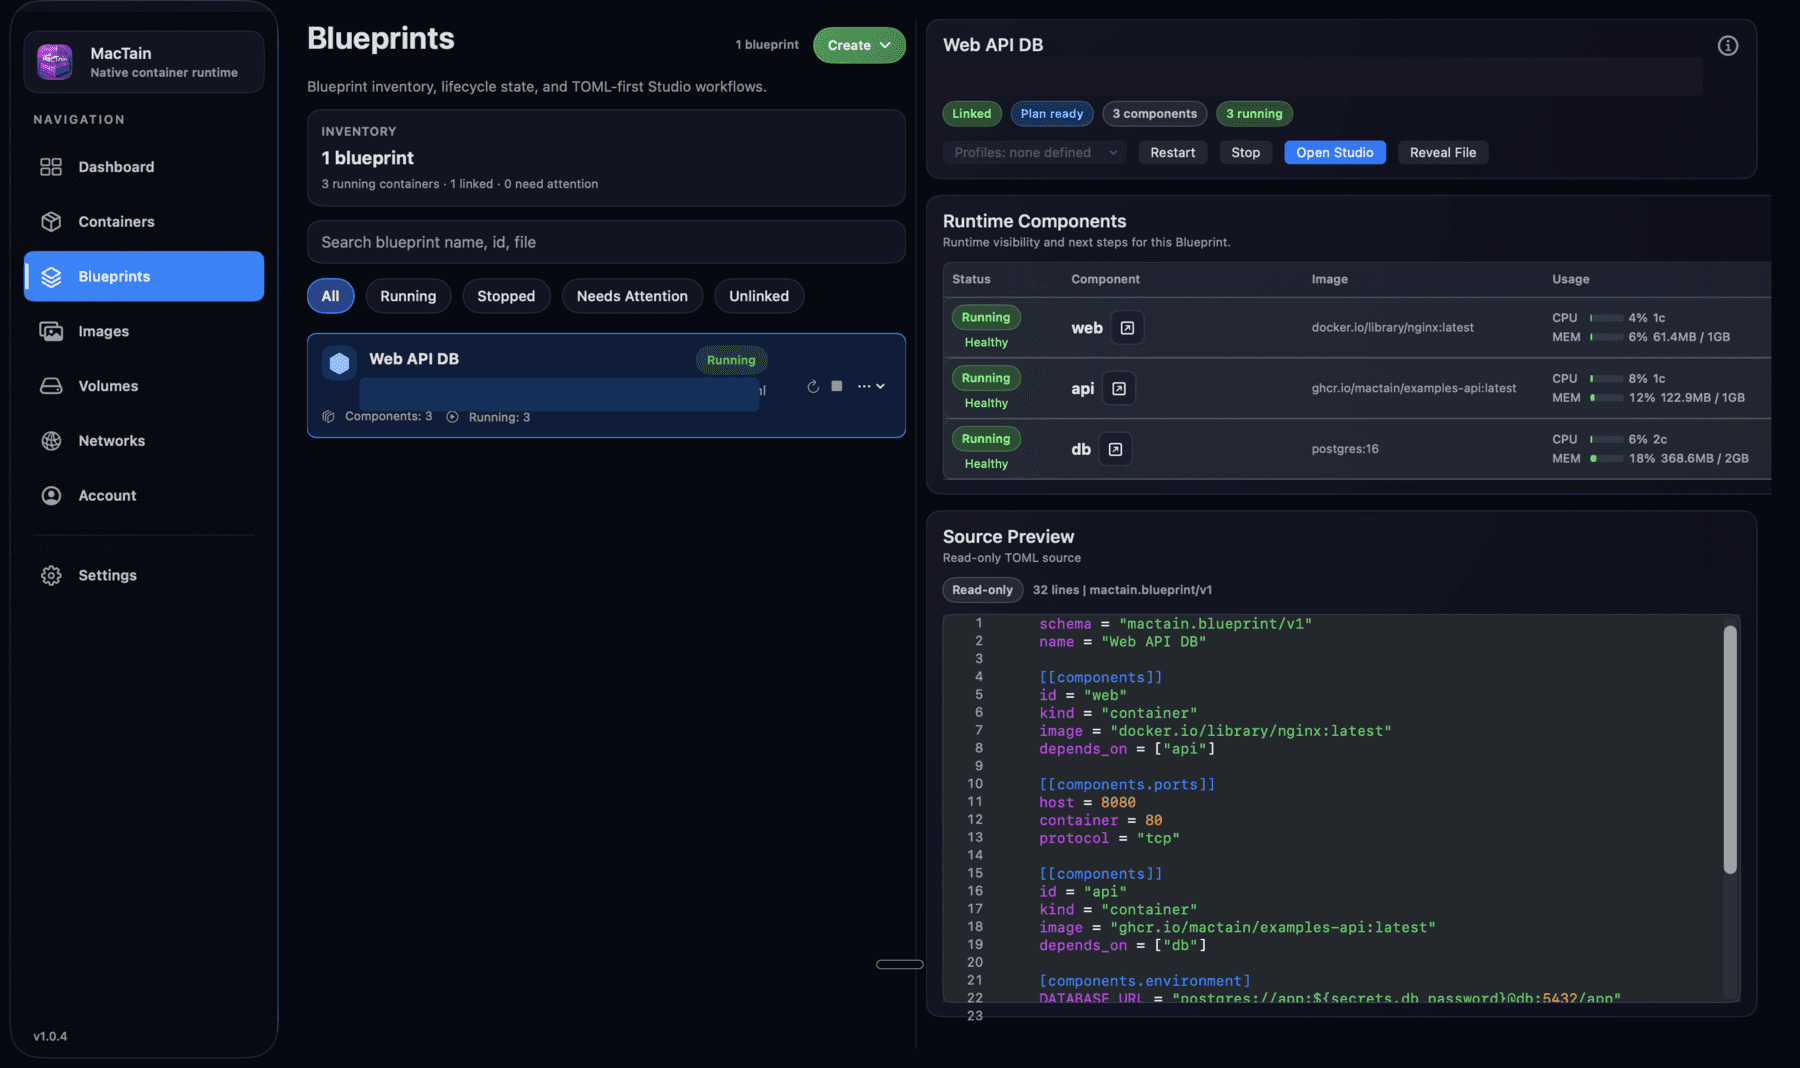
A native dashboard shows what matters. Containers, blueprints, resources, and alerts—all in one view.
- Live CPU and memory usage
- Uptime and resource health
- Top containers and alerts
- Start, stop, and restart with one click